

Mooseworks Trend Graph Control
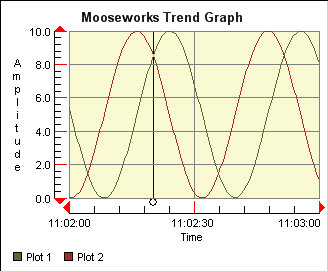
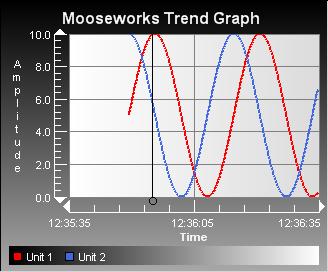 The Trend Graph Control provides real time, scrollable charting capabilities. Memory is handled by the Trend Graph's circular buffer, so you can add points in real time without worrying about memory growing out of control as time goes on. The Trend Graph also supports: Legends, Zooming, Date/Time, Logarithmic, Inverted axes, Right and Left Y-Axes, Markers, Cursor Values, Alarms, and more, while still providing excellent performance. It supports line, scatter graphing and line and symbol modes, and they can be used in combination in one graph.
You can even define the image to be used as a data point symbol. We've also added extensibility events that allow you to draw on the graph's canvas. This allows you the flexibility to customize the graph's appearance by drawing marker lines, image backgrounds, gradient surfaces, etc. Source code is now available. No redistribution licensing fees and free updates for one full year. Mooseworks Software stands behind our controls, see what other customers have to say.
New! Trend Graph Control for Android!
We've re-created our most popular controls for the Mono for Android framework. These controls have all of the same features as the Windows CE controls, but were re-written to take advantage of the Android operating system.
Pricing
| Description | Platform | VS Version | Price | Price with Source |
|---|---|---|---|---|
| Mooseworks Android Trend Graph Control | Mono | 2010/MonoDevelop | $149.00 Purchase |
$299.00 Purchase |
| Mooseworks Trend Graph Control (v3.0) | Compact Framework | 2008 (CF 3.5) | $149.00 Purchase |
$299.00 Purchase |
| Mooseworks Trend Graph Control (v3.0) | Windows Forms | 2008 | $149.00 Purchase |
$299.00 Purchase |
| Mooseworks Trend Graph Control (v2.0) | Compact Framework | 2005 (CF 2.0) | $149.00 Purchase |
$299.00 Purchase |
| Mooseworks Trend Graph Control (v2.0) | Windows Forms | 2005 | $149.00 Purchase |
$299.00 Purchase |
When you click the Buy button, you will be taken to a secure shopping cart. Just confirm the order, and you will be able to download the controls immediately.
Download Full-Featured Demonstration Versions
| Demo Download | Platform | VS Version |
|---|---|---|
| Android Trend Graph Control | Mono | 2010/MonoDevelop |
| Mobile Trend Graph Control 2008 | Compact Framework | 2008 (CF 3.5) |
| Desktop Trend Graph Control 2008 | Windows Forms | 2008 |
| Mobile Trend Graph Control 2005 | Compact Framework | 2005 (CF 2.0) |
| Desktop Trend Graph Control 2005 | Windows Forms | 2005 |
Features
- Line, Area, Scatter, Line and Symbol or combination plot types
- Automatic circular buffer handles data point array allocation
- Add data points in real time
- Multiple X and Y data series
- Customizable data point symbols - preset symbols or your images
- Graph Legend with circular or square symbols
- Right and Left Y axes
- Scrollable axes
- Logarithmic, inverted and normal axes in any combination
- DateTime mode for X-Axis data
- Zoom mode. The user can outline an area on the graph with the pen, and when the pen is lifted, the graph will zoom onto that area. Zooming in can be done an unlimited amount of times. Menus are available for zooming out. Just tap outside the graphs plot area.
- Auto scaling
- User moveable marker lines with events
- Plot alarm settings - plot will change colors in alarm regions
- Title and Axes Labels
- Cursor event
- Text File and Bitmap File Export
- Enter an unlimited number of data series
- Data can be entered as two arrays (X and Y data) or as one combined array
- Full customization:
- Title font and color
- Legend location, labels, fonts and colors
- Axis labels, precision, fonts and colors
- Major and minor tick mark spacing and colors
- Major and minor grid colors and visibility
- Auto or manual scaling
- Colors for each individual plot
- Border colors width, and styles (3D, single, none)
- Chart background and plot background colors
- Chart background and plot background images
- Gradient surfaces for the background, plot and legend areas
- Owner drawing capability for drawing marker lines, image backgrounds, etc.